 العربية
 English
 हिन्दी
 Malay
Malay اُردُو
 বাংলা
বাংলা Français
 Português
 Italiano
 Nederlands
 Deutsch
 Русский
 Español
 中文
中文 ไทย
ไทย Türkçe
Trader Dashboard

Added By BridgingFX
Product overview
Everything you need to know about this product
Trader Dashboard
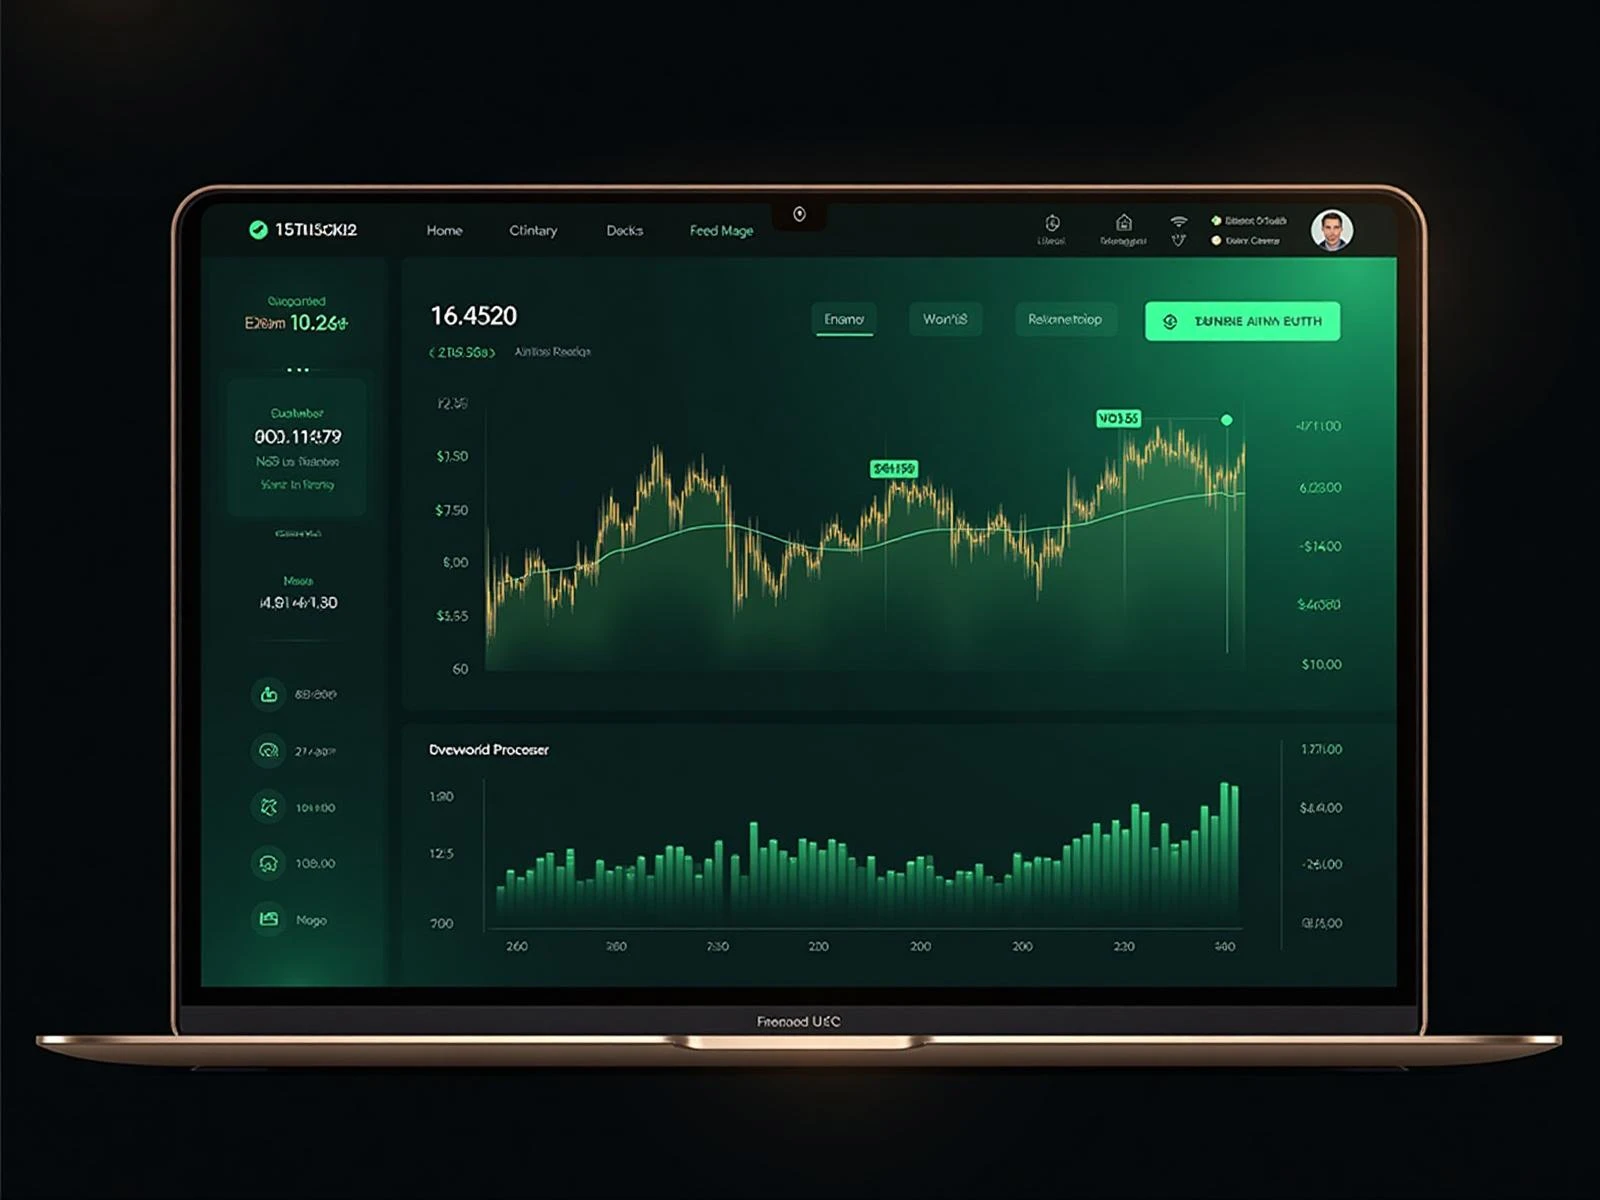
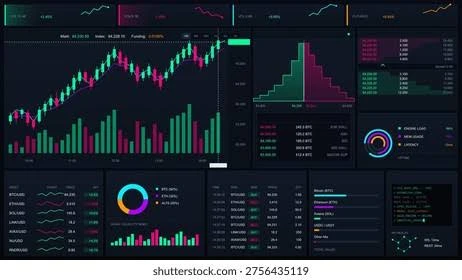
Every serious trader needs more than a list of transactions. They need a clear, centralized view of performance, risk, trading behavior, and account activity that turns complex trading data into information they can actually use. Our Trader Dashboard provides traders with a dedicated environment for monitoring live account performance, analyzing historical activity, understanding risk, and making more informed trading decisions.
The dashboard connects directly with supported trading platforms and account systems to bring relevant trading information into a single, intuitive interface. Instead of switching between trading terminals, spreadsheets, reports, and separate analytics tools, traders can monitor important metrics from one centralized dashboard.
Live balances, equity, margin, drawdown, exposure, open positions, trading volume, and performance indicators can be presented through customizable widgets and visual analytics. Historical trade logs, strategy notes, tagging, performance reports, and account comparisons turn the dashboard into an ongoing performance companion rather than simply another reporting screen.
Designed for individual traders, prop firm traders, brokerage clients, portfolio managers, and trading communities, the platform can be customized around the metrics, account structures, and workflows that matter most to your users.
Real-Time Trading Data
The dashboard can connect directly with supported trading platforms and account infrastructure to provide current trading information.
Relevant account and market activity can be synchronized into the dashboard, giving traders a more immediate view of their positions, balances, equity, margin, and other performance indicators.
Live Account Monitoring
Traders can monitor their active trading accounts through a centralized interface.
Instead of opening multiple trading terminals or manually checking account information, users can access important account metrics from their personalized dashboard.
Real-Time Balance and Equity
Balance and equity provide fundamental information about an account's current condition.
The dashboard can display these metrics alongside other performance indicators, helping traders understand how open positions and realized trading activity are affecting their account.
Margin Monitoring
Margin availability is an important part of managing leveraged trading accounts.
The dashboard can display relevant margin metrics, allowing traders to monitor used margin, available margin, and other supported indicators while managing active positions.
Drawdown Tracking
Drawdown is one of the most important risk metrics for disciplined traders and prop firm participants.
The dashboard can provide real-time and historical drawdown information, helping users understand how far their account has moved from relevant performance or equity reference points.
Maximum Drawdown Monitoring
For traders operating under specific risk rules, maximum drawdown can be especially important.
The dashboard can show progress against configured drawdown limits and highlight relevant thresholds so traders can better understand their remaining risk capacity.
Exposure Monitoring
Traders need to understand not only individual positions but also their combined market exposure.
The dashboard can provide aggregate exposure information across open positions, instruments, currencies, account groups, or other supported categories.
Position Overview
Open positions can be presented in a centralized view with relevant information such as instrument, direction, volume, entry information, current status, and available trading metrics.
This gives traders a quick overview of their current market commitments.
Open and Closed Trade Analysis
The dashboard can separate active positions from historical trades, helping users understand both current exposure and completed trading activity.
This creates a clearer distinction between what is happening now and what has already contributed to account performance.
Multiple Account Management
Many professional traders operate more than one trading account.
The Trader Dashboard can connect multiple supported accounts and allow users to monitor them from a single environment rather than switching between separate interfaces.
Side-by-Side Account Comparison
Connected accounts can be viewed individually or compared side by side.
This can help traders identify differences in performance, drawdown, exposure, trading volume, strategy behavior, or other selected metrics.
Consolidated Performance View
For traders managing several accounts, a consolidated view can provide a broader picture of overall trading performance.
Relevant account data can be aggregated into a unified overview while preserving the ability to drill down into individual accounts.
Customizable Dashboard Widgets
Every trader has different priorities. Some may focus on drawdown, while others may prioritize win rate, exposure, profit factor, or trading volume.
Customizable widgets allow users to organize their dashboard around the metrics they consider most important.
Personalized Dashboard Layouts
Users can configure their dashboard layout to create a more personalized experience.
Relevant widgets can be prioritized and organized according to the trader's workflow, helping important information remain visible without unnecessary clutter.
Performance Overview
A centralized performance overview can present key metrics in an easy-to-understand format.
Depending on the connected trading data, this can include profit and loss, win rate, average trade, trading volume, drawdown, risk metrics, and other performance indicators.
Profit and Loss Tracking
The dashboard can provide clear views of realized and relevant unrealized profit and loss.
Traders can monitor performance over selected periods and compare results across accounts, instruments, or trading strategies.
Win Rate Analysis
Win rate provides useful context when evaluating trading performance.
The dashboard can calculate and display win/loss statistics over selected time periods, helping traders understand how consistently their strategies are producing successful outcomes.
Risk-to-Reward Analysis
Where sufficient trade data is available, the dashboard can help traders analyze risk-to-reward characteristics across their trading history.
This can provide additional context when reviewing strategies and individual trading decisions.
Trading Volume Analysis
Trading volume can reveal changes in trading behavior and activity.
The dashboard can present volume statistics by account, instrument, period, or other relevant dimensions, helping traders identify changes in activity over time.
Instrument Performance
Different instruments can produce different results for the same trader.
The dashboard can break down trading performance by instrument, allowing users to identify which markets have contributed positively or negatively to their historical results.
Currency Exposure
For forex traders, understanding currency exposure can be particularly valuable.
The dashboard can provide relevant exposure information across currencies and currency pairs to help traders understand where their positions are concentrated.
Historical Trade Logs
Every completed trade represents a learning opportunity.
The dashboard can provide detailed historical trade logs that allow users to review past positions, entry and exit information, outcomes, timing, volume, and other available trading data.
Advanced Trade Filtering
Large trade histories can become difficult to analyze without filtering tools.
Traders can filter historical activity based on relevant criteria such as date range, instrument, direction, result, account, strategy tag, or other supported fields.
Trade Search
A search function can help traders quickly locate specific trades or groups of trades.
This makes historical analysis more efficient, particularly for users managing large trading histories.
Strategy Tagging
Traders can assign tags to individual trades or groups of trades based on their strategy or setup.
Examples may include breakout, reversal, trend-following, news trade, scalping, swing, or other trader-defined classifications.
Trading Journal
The dashboard can incorporate journal functionality that allows traders to record observations about their trading decisions.
Notes can capture the reasoning behind a trade, market conditions, emotions, execution quality, or lessons learned for future review.
Trade Notes
Individual trades can include notes that help traders remember why a position was opened, how it was managed, and what happened during the trade.
Over time, these notes can create a valuable record for strategy development.
Strategy Performance Analysis
Once trades are tagged by strategy, traders can compare results across different approaches.
This can help identify which setups generate stronger performance, which strategies produce excessive drawdown, and where adjustments may be required.
Trading Behavior Analysis
Performance is influenced not only by strategy but also by trader behavior.
The dashboard can help users identify patterns such as overtrading, inconsistent position sizing, frequent early exits, extended losing periods, or concentration in particular instruments.
Daily and Weekly Performance
Traders can review performance across specific periods to identify changes in results and behavior.
Daily, weekly, monthly, or custom date-range analysis can provide a clearer picture of consistency over time.
Monthly Performance Tracking
Longer-term performance views can help traders understand whether their results are improving, declining, or remaining consistent.
Monthly comparisons can provide useful context beyond individual trade outcomes.
Equity Curve Visualization
Visual equity curves can make performance trends easier to understand than raw numbers alone.
The dashboard can display account performance over time, helping traders identify growth periods, drawdowns, recoveries, and changes in performance consistency.
Drawdown Visualization
Drawdown can also be represented visually to show when significant declines occurred and how long recovery periods lasted.
This provides useful context when reviewing historical risk behavior.
Performance Trend Analysis
Historical performance can be analyzed through trends rather than isolated results.
Traders can identify changes in profitability, win rate, trading frequency, drawdown, or other metrics over selected periods.
Risk Metrics
The dashboard can centralize key risk indicators so traders do not have to calculate them manually.
Depending on available trading data, metrics can include drawdown, exposure, margin utilization, position size, concentration, and other relevant measures.
Risk Limit Monitoring
For prop firm traders or accounts operating under predefined rules, the dashboard can display relevant risk thresholds.
This can help traders understand how close their account is to configured limits and encourage more disciplined risk management.
Prop Firm Trader Dashboard
Prop firm traders often need to monitor performance against specific trading rules.
The dashboard can display relevant account metrics, drawdown, profit targets, trading activity, and other program-specific indicators to help traders understand their current standing.
Challenge Progress Tracking
For evaluation accounts, traders can monitor progress toward configured objectives.
Depending on the prop firm's rules, the dashboard can display relevant profit targets, drawdown conditions, trading-day requirements, or other supported challenge metrics.
Performance Goals
Traders can define personal or account-specific performance goals and monitor progress through the dashboard.
This creates a more structured approach to evaluating trading activity and maintaining consistency.
Alerts and Notifications
Important account events can trigger notifications according to configured rules.
Alerts may be used for drawdown thresholds, margin conditions, significant account changes, performance milestones, or other supported events.
Risk Threshold Alerts
Instead of constantly watching the dashboard, traders can receive alerts when selected risk metrics reach predefined levels.
This can help users respond more quickly to changing account conditions.
Performance Milestone Notifications
The system can also notify traders about selected performance milestones.
These notifications can help maintain awareness of progress while keeping the dashboard focused on meaningful account events.
Automated Reports
Traders can generate reports summarizing account activity and performance over selected periods.
Reports can include trading history, profit and loss, drawdown, exposure, performance metrics, and other available information.
Exportable Trading Reports
Users can export supported trading data for personal records, analysis, accounting, tax preparation, performance reviews, or other legitimate business and financial purposes.
Export formats can be tailored to the requirements of the connected system.
Tax and Financial Record Support
Maintaining organized trading records can make financial administration easier.
Exportable transaction histories and performance reports can provide useful source information for traders and their professional advisors, subject to applicable tax and reporting requirements.
Performance Sharing
Where enabled by the platform owner, selected performance information can be prepared for sharing with mentors, managers, prop firms, strategy providers, or other authorized parties.
Privacy controls can determine which information is visible.
Privacy and Account Data Separation
Each trader should have access only to their own authorized information.
The dashboard can use authentication and permission controls to separate account data and protect customer information.
Secure Authentication
Secure login and authentication workflows can protect access to individual trader dashboards.
Additional authentication measures can be incorporated according to the security requirements of the deployment.
Role-Based Access Control
For platforms supporting traders, managers, administrators, or support teams, role-based permissions can determine which dashboards and functions each user can access.
This creates controlled access to account, reporting, and administrative information.
Trading Platform Integration
The dashboard can connect with supported trading platforms and account-management systems to retrieve relevant trading information.
This creates a direct connection between live trading activity and the trader's performance environment.
CRM Integration
For brokers and prop firms, the dashboard can also connect with CRM systems to associate trading accounts with the appropriate customer records.
This enables a more connected environment between client management and trading performance.
API Integration
The dashboard can communicate with external systems through APIs and integration layers.
This allows trading information to be combined with CRM data, account services, risk systems, payment infrastructure, reporting platforms, and other business applications where appropriate.
Automated Data Synchronization
Trading information can be synchronized automatically so users do not have to manually upload or maintain spreadsheets.
This creates a more efficient performance-monitoring process and helps keep dashboard information aligned with connected account systems.
Data Accuracy and Validation
Reliable performance analytics depend on accurate underlying trading data.
The platform can incorporate data validation and synchronization checks designed to identify incomplete, inconsistent, or unexpected information.
Centralized Trader Profile
Each trader can have a centralized profile containing relevant accounts, performance information, trading history, preferences, notes, and other permitted information.
This creates a consistent foundation for personalized dashboard experiences.
Mobile-Responsive Dashboard
Traders increasingly monitor markets and account performance from different devices.
The dashboard can be designed responsively so relevant information remains accessible across desktop, tablet, and mobile screens.
Intuitive User Experience
Trading dashboards can quickly become overwhelming when too much information is displayed at once.
Our approach focuses on clear information hierarchy, visual organization, intuitive navigation, and configurable components so traders can access important metrics without unnecessary complexity.
Data Visualization
Raw numbers do not always provide enough context.
Charts, graphs, performance curves, comparison views, and other visualizations can transform complex trading information into patterns that are easier to understand.
Custom Reporting
Different traders and businesses require different reports.
The platform can support customizable reporting structures based on the metrics, account types, strategies, and performance indicators relevant to your users.
Automated Performance Summaries
The system can generate structured performance summaries over selected time periods.
These summaries can help traders quickly understand recent activity without manually reviewing every individual trade.
Trader Development and Improvement
A strong dashboard should not simply show whether a trader made or lost money. It should help them understand why.
Combining performance statistics, historical trades, strategy tags, notes, risk metrics, and behavioral analysis creates a foundation for continuous trading improvement.
Built for Prop Firms and Brokers
The Trader Dashboard can be integrated into prop firm and brokerage ecosystems to provide traders with a dedicated performance environment.
It can complement challenge platforms, CRM systems, trading infrastructure, risk-management systems, and client portals.
Scalable Trader Infrastructure
Whether supporting a small group of professional traders or a large client and trader population, the dashboard can be designed around scalable data processing, account synchronization, user management, and reporting requirements.
This allows the platform to evolve alongside your trading business.
Reduce Dependence on Spreadsheets
Spreadsheets can be useful for basic record keeping, but they become difficult to maintain when trading data changes continuously and multiple accounts are involved.
The Trader Dashboard provides a centralized, automated environment for performance monitoring, analysis, and reporting.
Turn Trading Data Into Actionable Insight
The value of trading data comes from understanding what it means. By transforming balances, positions, trade history, risk metrics, and performance statistics into visual and interactive insights, the dashboard helps traders move beyond simply observing results.
Build a Complete Performance Companion
A professional trader dashboard should bring together live account monitoring, historical analysis, risk visibility, strategy journaling, performance reporting, and personalized analytics in one environment.
Our Trader Dashboard is designed to give traders the information they need to monitor their accounts, review their decisions, identify patterns, and develop a more disciplined approach to trading.
Monitor live performance. Track drawdown and exposure. Manage multiple accounts, analyze historical trades, tag strategies, record trading notes, receive risk alerts, and generate detailed reports—all through a centralized trader experience designed to turn complex trading data into clear, actionable insight.
Product description
Learn more about product features and benefits
Trader Dashboard
Every serious trader needs more than a list of transactions. They need a clear, centralized view of performance, risk, trading behavior, and account activity that turns complex trading data into information they can actually use. Our Trader Dashboard provides traders with a dedicated environment for monitoring live account performance, analyzing historical activity, understanding risk, and making more informed trading decisions.
The dashboard connects directly with supported trading platforms and account systems to bring relevant trading information into a single, intuitive interface. Instead of switching between trading terminals, spreadsheets, reports, and separate analytics tools, traders can monitor important metrics from one centralized dashboard.
Live balances, equity, margin, drawdown, exposure, open positions, trading volume, and performance indicators can be presented through customizable widgets and visual analytics. Historical trade logs, strategy notes, tagging, performance reports, and account comparisons turn the dashboard into an ongoing performance companion rather than simply another reporting screen.
Designed for individual traders, prop firm traders, brokerage clients, portfolio managers, and trading communities, the platform can be customized around the metrics, account structures, and workflows that matter most to your users.
Real-Time Trading Data
The dashboard can connect directly with supported trading platforms and account infrastructure to provide current trading information.
Relevant account and market activity can be synchronized into the dashboard, giving traders a more immediate view of their positions, balances, equity, margin, and other performance indicators.
Live Account Monitoring
Traders can monitor their active trading accounts through a centralized interface.
Instead of opening multiple trading terminals or manually checking account information, users can access important account metrics from their personalized dashboard.
Real-Time Balance and Equity
Balance and equity provide fundamental information about an account's current condition.
The dashboard can display these metrics alongside other performance indicators, helping traders understand how open positions and realized trading activity are affecting their account.
Margin Monitoring
Margin availability is an important part of managing leveraged trading accounts.
The dashboard can display relevant margin metrics, allowing traders to monitor used margin, available margin, and other supported indicators while managing active positions.
Drawdown Tracking
Drawdown is one of the most important risk metrics for disciplined traders and prop firm participants.
The dashboard can provide real-time and historical drawdown information, helping users understand how far their account has moved from relevant performance or equity reference points.
Maximum Drawdown Monitoring
For traders operating under specific risk rules, maximum drawdown can be especially important.
The dashboard can show progress against configured drawdown limits and highlight relevant thresholds so traders can better understand their remaining risk capacity.
Exposure Monitoring
Traders need to understand not only individual positions but also their combined market exposure.
The dashboard can provide aggregate exposure information across open positions, instruments, currencies, account groups, or other supported categories.
Position Overview
Open positions can be presented in a centralized view with relevant information such as instrument, direction, volume, entry information, current status, and available trading metrics.
This gives traders a quick overview of their current market commitments.
Open and Closed Trade Analysis
The dashboard can separate active positions from historical trades, helping users understand both current exposure and completed trading activity.
This creates a clearer distinction between what is happening now and what has already contributed to account performance.
Multiple Account Management
Many professional traders operate more than one trading account.
The Trader Dashboard can connect multiple supported accounts and allow users to monitor them from a single environment rather than switching between separate interfaces.
Side-by-Side Account Comparison
Connected accounts can be viewed individually or compared side by side.
This can help traders identify differences in performance, drawdown, exposure, trading volume, strategy behavior, or other selected metrics.
Consolidated Performance View
For traders managing several accounts, a consolidated view can provide a broader picture of overall trading performance.
Relevant account data can be aggregated into a unified overview while preserving the ability to drill down into individual accounts.
Customizable Dashboard Widgets
Every trader has different priorities. Some may focus on drawdown, while others may prioritize win rate, exposure, profit factor, or trading volume.
Customizable widgets allow users to organize their dashboard around the metrics they consider most important.
Personalized Dashboard Layouts
Users can configure their dashboard layout to create a more personalized experience.
Relevant widgets can be prioritized and organized according to the trader's workflow, helping important information remain visible without unnecessary clutter.
Performance Overview
A centralized performance overview can present key metrics in an easy-to-understand format.
Depending on the connected trading data, this can include profit and loss, win rate, average trade, trading volume, drawdown, risk metrics, and other performance indicators.
Profit and Loss Tracking
The dashboard can provide clear views of realized and relevant unrealized profit and loss.
Traders can monitor performance over selected periods and compare results across accounts, instruments, or trading strategies.
Win Rate Analysis
Win rate provides useful context when evaluating trading performance.
The dashboard can calculate and display win/loss statistics over selected time periods, helping traders understand how consistently their strategies are producing successful outcomes.
Risk-to-Reward Analysis
Where sufficient trade data is available, the dashboard can help traders analyze risk-to-reward characteristics across their trading history.
This can provide additional context when reviewing strategies and individual trading decisions.
Trading Volume Analysis
Trading volume can reveal changes in trading behavior and activity.
The dashboard can present volume statistics by account, instrument, period, or other relevant dimensions, helping traders identify changes in activity over time.
Instrument Performance
Different instruments can produce different results for the same trader.
The dashboard can break down trading performance by instrument, allowing users to identify which markets have contributed positively or negatively to their historical results.
Currency Exposure
For forex traders, understanding currency exposure can be particularly valuable.
The dashboard can provide relevant exposure information across currencies and currency pairs to help traders understand where their positions are concentrated.
Historical Trade Logs
Every completed trade represents a learning opportunity.
The dashboard can provide detailed historical trade logs that allow users to review past positions, entry and exit information, outcomes, timing, volume, and other available trading data.
Advanced Trade Filtering
Large trade histories can become difficult to analyze without filtering tools.
Traders can filter historical activity based on relevant criteria such as date range, instrument, direction, result, account, strategy tag, or other supported fields.
Trade Search
A search function can help traders quickly locate specific trades or groups of trades.
This makes historical analysis more efficient, particularly for users managing large trading histories.
Strategy Tagging
Traders can assign tags to individual trades or groups of trades based on their strategy or setup.
Examples may include breakout, reversal, trend-following, news trade, scalping, swing, or other trader-defined classifications.
Trading Journal
The dashboard can incorporate journal functionality that allows traders to record observations about their trading decisions.
Notes can capture the reasoning behind a trade, market conditions, emotions, execution quality, or lessons learned for future review.
Trade Notes
Individual trades can include notes that help traders remember why a position was opened, how it was managed, and what happened during the trade.
Over time, these notes can create a valuable record for strategy development.
Strategy Performance Analysis
Once trades are tagged by strategy, traders can compare results across different approaches.
This can help identify which setups generate stronger performance, which strategies produce excessive drawdown, and where adjustments may be required.
Trading Behavior Analysis
Performance is influenced not only by strategy but also by trader behavior.
The dashboard can help users identify patterns such as overtrading, inconsistent position sizing, frequent early exits, extended losing periods, or concentration in particular instruments.
Daily and Weekly Performance
Traders can review performance across specific periods to identify changes in results and behavior.
Daily, weekly, monthly, or custom date-range analysis can provide a clearer picture of consistency over time.
Monthly Performance Tracking
Longer-term performance views can help traders understand whether their results are improving, declining, or remaining consistent.
Monthly comparisons can provide useful context beyond individual trade outcomes.
Equity Curve Visualization
Visual equity curves can make performance trends easier to understand than raw numbers alone.
The dashboard can display account performance over time, helping traders identify growth periods, drawdowns, recoveries, and changes in performance consistency.
Drawdown Visualization
Drawdown can also be represented visually to show when significant declines occurred and how long recovery periods lasted.
This provides useful context when reviewing historical risk behavior.
Performance Trend Analysis
Historical performance can be analyzed through trends rather than isolated results.
Traders can identify changes in profitability, win rate, trading frequency, drawdown, or other metrics over selected periods.
Risk Metrics
The dashboard can centralize key risk indicators so traders do not have to calculate them manually.
Depending on available trading data, metrics can include drawdown, exposure, margin utilization, position size, concentration, and other relevant measures.
Risk Limit Monitoring
For prop firm traders or accounts operating under predefined rules, the dashboard can display relevant risk thresholds.
This can help traders understand how close their account is to configured limits and encourage more disciplined risk management.
Prop Firm Trader Dashboard
Prop firm traders often need to monitor performance against specific trading rules.
The dashboard can display relevant account metrics, drawdown, profit targets, trading activity, and other program-specific indicators to help traders understand their current standing.
Challenge Progress Tracking
For evaluation accounts, traders can monitor progress toward configured objectives.
Depending on the prop firm's rules, the dashboard can display relevant profit targets, drawdown conditions, trading-day requirements, or other supported challenge metrics.
Performance Goals
Traders can define personal or account-specific performance goals and monitor progress through the dashboard.
This creates a more structured approach to evaluating trading activity and maintaining consistency.
Alerts and Notifications
Important account events can trigger notifications according to configured rules.
Alerts may be used for drawdown thresholds, margin conditions, significant account changes, performance milestones, or other supported events.
Risk Threshold Alerts
Instead of constantly watching the dashboard, traders can receive alerts when selected risk metrics reach predefined levels.
This can help users respond more quickly to changing account conditions.
Performance Milestone Notifications
The system can also notify traders about selected performance milestones.
These notifications can help maintain awareness of progress while keeping the dashboard focused on meaningful account events.
Automated Reports
Traders can generate reports summarizing account activity and performance over selected periods.
Reports can include trading history, profit and loss, drawdown, exposure, performance metrics, and other available information.
Exportable Trading Reports
Users can export supported trading data for personal records, analysis, accounting, tax preparation, performance reviews, or other legitimate business and financial purposes.
Export formats can be tailored to the requirements of the connected system.
Tax and Financial Record Support
Maintaining organized trading records can make financial administration easier.
Exportable transaction histories and performance reports can provide useful source information for traders and their professional advisors, subject to applicable tax and reporting requirements.
Performance Sharing
Where enabled by the platform owner, selected performance information can be prepared for sharing with mentors, managers, prop firms, strategy providers, or other authorized parties.
Privacy controls can determine which information is visible.
Privacy and Account Data Separation
Each trader should have access only to their own authorized information.
The dashboard can use authentication and permission controls to separate account data and protect customer information.
Secure Authentication
Secure login and authentication workflows can protect access to individual trader dashboards.
Additional authentication measures can be incorporated according to the security requirements of the deployment.
Role-Based Access Control
For platforms supporting traders, managers, administrators, or support teams, role-based permissions can determine which dashboards and functions each user can access.
This creates controlled access to account, reporting, and administrative information.
Trading Platform Integration
The dashboard can connect with supported trading platforms and account-management systems to retrieve relevant trading information.
This creates a direct connection between live trading activity and the trader's performance environment.
CRM Integration
For brokers and prop firms, the dashboard can also connect with CRM systems to associate trading accounts with the appropriate customer records.
This enables a more connected environment between client management and trading performance.
API Integration
The dashboard can communicate with external systems through APIs and integration layers.
This allows trading information to be combined with CRM data, account services, risk systems, payment infrastructure, reporting platforms, and other business applications where appropriate.
Automated Data Synchronization
Trading information can be synchronized automatically so users do not have to manually upload or maintain spreadsheets.
This creates a more efficient performance-monitoring process and helps keep dashboard information aligned with connected account systems.
Data Accuracy and Validation
Reliable performance analytics depend on accurate underlying trading data.
The platform can incorporate data validation and synchronization checks designed to identify incomplete, inconsistent, or unexpected information.
Centralized Trader Profile
Each trader can have a centralized profile containing relevant accounts, performance information, trading history, preferences, notes, and other permitted information.
This creates a consistent foundation for personalized dashboard experiences.
Mobile-Responsive Dashboard
Traders increasingly monitor markets and account performance from different devices.
The dashboard can be designed responsively so relevant information remains accessible across desktop, tablet, and mobile screens.
Intuitive User Experience
Trading dashboards can quickly become overwhelming when too much information is displayed at once.
Our approach focuses on clear information hierarchy, visual organization, intuitive navigation, and configurable components so traders can access important metrics without unnecessary complexity.
Data Visualization
Raw numbers do not always provide enough context.
Charts, graphs, performance curves, comparison views, and other visualizations can transform complex trading information into patterns that are easier to understand.
Custom Reporting
Different traders and businesses require different reports.
The platform can support customizable reporting structures based on the metrics, account types, strategies, and performance indicators relevant to your users.
Automated Performance Summaries
The system can generate structured performance summaries over selected time periods.
These summaries can help traders quickly understand recent activity without manually reviewing every individual trade.
Trader Development and Improvement
A strong dashboard should not simply show whether a trader made or lost money. It should help them understand why.
Combining performance statistics, historical trades, strategy tags, notes, risk metrics, and behavioral analysis creates a foundation for continuous trading improvement.
Built for Prop Firms and Brokers
The Trader Dashboard can be integrated into prop firm and brokerage ecosystems to provide traders with a dedicated performance environment.
It can complement challenge platforms, CRM systems, trading infrastructure, risk-management systems, and client portals.
Scalable Trader Infrastructure
Whether supporting a small group of professional traders or a large client and trader population, the dashboard can be designed around scalable data processing, account synchronization, user management, and reporting requirements.
This allows the platform to evolve alongside your trading business.
Reduce Dependence on Spreadsheets
Spreadsheets can be useful for basic record keeping, but they become difficult to maintain when trading data changes continuously and multiple accounts are involved.
The Trader Dashboard provides a centralized, automated environment for performance monitoring, analysis, and reporting.
Turn Trading Data Into Actionable Insight
The value of trading data comes from understanding what it means. By transforming balances, positions, trade history, risk metrics, and performance statistics into visual and interactive insights, the dashboard helps traders move beyond simply observing results.
Build a Complete Performance Companion
A professional trader dashboard should bring together live account monitoring, historical analysis, risk visibility, strategy journaling, performance reporting, and personalized analytics in one environment.
Our Trader Dashboard is designed to give traders the information they need to monitor their accounts, review their decisions, identify patterns, and develop a more disciplined approach to trading.
Monitor live performance. Track drawdown and exposure. Manage multiple accounts, analyze historical trades, tag strategies, record trading notes, receive risk alerts, and generate detailed reports—all through a centralized trader experience designed to turn complex trading data into clear, actionable insight.
Product specification
Quick product information

No review given yet!