 العربية
 English
 हिन्दी
 Malay
Malay اُردُو
 বাংলা
বাংলা Français
 Português
 Italiano
 Nederlands
 Deutsch
 Русский
 Español
 中文
中文 ไทย
ไทย Türkçe
Dashboard Development

Added By BridgingFX
Product overview
Everything you need to know about this product
Dashboard Development
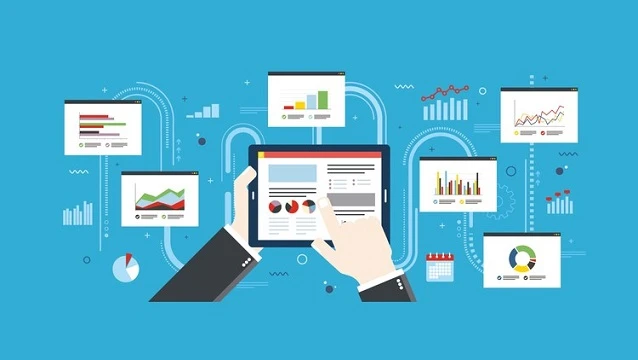
Modern businesses generate enormous amounts of operational, financial, customer, and performance data. Without the right interface, valuable information can become buried in spreadsheets, disconnected reports, and manual processes. Our Dashboard Development service transforms complex data into intuitive, real-time dashboards designed around the metrics, workflows, and decisions that matter most to your business.
From trading activity and client performance to financial reporting and operational analytics, we build custom dashboards that make information easier to understand, monitor, and act upon.
Custom Dashboard Architecture
Every business measures performance differently. We design dashboard architecture around your specific objectives, data sources, user roles, workflows, and reporting requirements.
Rather than forcing your team into a predefined dashboard structure, we create interfaces that display the information your organization actually needs.
Real-Time Data Integration
Accurate decision-making depends on current information. Our dashboards can integrate with databases, APIs, trading systems, CRM platforms, financial systems, and other data sources to provide continuously updated information.
Real-time or near-real-time data integration reduces reliance on outdated exports and gives authorized users a clearer view of current business activity.
Financial and Trading Analytics
Financial businesses often need to monitor large volumes of rapidly changing information. We can develop dashboards covering areas such as:
- Trading volumes
- Client activity
- Deposits and withdrawals
- Revenue and fees
- Account performance
- Transaction activity
- Asset balances
- Market activity
- Customer acquisition
- Financial performance
These metrics can be presented through clear visualizations that help teams identify important changes quickly.
Role-Based Access Control
Different departments require different information. Our dashboards can incorporate role-based access controls so users only see the data and functionality relevant to their responsibilities.
Administrators, finance teams, sales representatives, compliance teams, managers, and other roles can have customized dashboard views and permissions.
Interactive Charts and Visualizations
Numbers become easier to understand when presented visually. We develop interactive charts, graphs, tables, KPI cards, progress indicators, and other visualization components to communicate complex information clearly.
Users can interact with visualizations to explore trends, compare results, and identify important changes without manually processing large datasets.
Advanced Filtering and Drill-Down
A useful dashboard should allow users to move from high-level performance indicators into the details behind them.
Custom filters and drill-down functionality can allow users to analyze information by:
- Date and time period
- Customer or account
- Product or service
- Geographic region
- Trading pair or asset
- Department
- Transaction type
- Campaign
- Performance category
- Other business-specific segments
This makes detailed analysis accessible without requiring manual spreadsheet manipulation.
Custom KPI Tracking
Every organization has different definitions of success. We build dashboards around the KPIs that are most relevant to your business.
Custom KPI components can display important measurements such as revenue, conversion rates, trading volumes, customer activity, acquisition costs, transaction counts, operational performance, and other business-specific indicators.
Automated Alerts and Thresholds
Important changes should not always require someone to constantly monitor a dashboard. Custom alert thresholds can be configured to identify specific conditions and notify relevant users when predefined limits are reached.
Alerts can support monitoring of financial metrics, trading activity, transaction volumes, account activity, system conditions, or other measurable business events.
Automated Reporting
Scheduled reporting reduces the need for teams to repeatedly prepare the same reports manually. Dashboards can be configured to generate and distribute recurring reports according to predefined schedules and recipient requirements.
This can help management and stakeholders stay informed without requiring someone to manually compile and distribute information each reporting period.
White-Label Dashboard Solutions
For businesses offering platforms to customers or partners, dashboards can be customized to match your existing brand identity.
Brand elements such as logos, typography, interface components, navigation structures, and visual guidelines can be incorporated to create a consistent experience under your own branding.
Admin and Management Dashboards
Management teams need visibility across the organization, while operational teams need detailed tools for day-to-day work. We design dashboards according to each user's responsibilities.
Administrative dashboards can include user management, financial information, operational statistics, reporting tools, system activity, configuration options, and other controls required by your organization.
Customer-Facing Dashboards
Dashboards can also be designed for customers and platform users. User-facing interfaces can provide account information, transaction history, balances, performance statistics, activity summaries, notifications, reports, and other relevant information.
The experience can be tailored to make important information easy to find and understand.
API and Database Integration
We connect dashboards with the systems that already power your business. Integrations can include REST APIs, databases, CRM systems, payment systems, trading platforms, ERP applications, analytics services, and other internal or third-party applications.
This creates a centralized view of information without requiring teams to switch between multiple systems.
Data Accuracy and Validation
A dashboard is only useful when the underlying information can be trusted. We consider data validation, synchronization, error handling, transformation, and consistency when building dashboard infrastructure.
Appropriate validation processes help reduce discrepancies and provide users with more reliable information for operational and analytical purposes.
Performance and Scalability
As data volumes and user numbers increase, dashboards need to remain responsive. We design dashboard architecture with performance and scalability in mind, including efficient data retrieval, appropriate caching strategies, optimized queries, and scalable infrastructure where required.
This helps maintain a practical user experience as your business grows.
Responsive Dashboard Design
Modern teams access information from different devices. Dashboards can be designed to work across desktop computers, laptops, tablets, and mobile devices where the use case requires it.
Responsive layouts ensure that important information remains accessible while adapting appropriately to different screen sizes.
Secure Data Access
Business dashboards frequently contain sensitive financial, customer, and operational information. Security is therefore considered throughout the development process.
Authentication, authorization, role-based access, secure API communication, session management, logging, and other appropriate security measures can be incorporated according to the platform's requirements.
Historical Data and Trend Analysis
Real-time information is valuable, but historical context is equally important. Dashboards can combine current data with historical records to help users identify trends, compare time periods, and evaluate changes in performance.
This creates a more complete view of business activity and supports informed decision-making.
Centralized Business Intelligence
Instead of relying on disconnected spreadsheets and manually prepared reports, a centralized dashboard can bring important information together in one environment.
Teams can access relevant KPIs, operational metrics, financial data, and performance information through a unified interface.
Continuous Improvement and Optimization
Business requirements change as organizations grow. Dashboard systems can be expanded with new metrics, reports, integrations, user roles, filters, alerts, and visualizations as new requirements emerge.
This allows your dashboard to evolve alongside your business rather than becoming another static reporting tool.
Built Around the Way Your Business Works
The most effective dashboard is not necessarily the one with the most charts. It is the one that presents the right information at the right time and makes important decisions easier.
Our Dashboard Development approach focuses on usability, data clarity, performance, security, automation, and practical business value.
Replace Manual Reporting With Intelligent Dashboards
Our Dashboard Development service transforms complex business data into structured, interactive, and actionable interfaces. From real-time financial and trading metrics to customer activity, operational KPIs, automated alerts, and scheduled reporting, every dashboard is built around your organization's specific requirements.
Bring your data together. Eliminate unnecessary manual reporting. Give every team access to the information they need.
Turn complex data into clear decisions. Automate reporting, monitor performance in real time, and build dashboards that genuinely work for your business.
Product description
Learn more about product features and benefits
Dashboard Development
Modern businesses generate enormous amounts of operational, financial, customer, and performance data. Without the right interface, valuable information can become buried in spreadsheets, disconnected reports, and manual processes. Our Dashboard Development service transforms complex data into intuitive, real-time dashboards designed around the metrics, workflows, and decisions that matter most to your business.
From trading activity and client performance to financial reporting and operational analytics, we build custom dashboards that make information easier to understand, monitor, and act upon.
Custom Dashboard Architecture
Every business measures performance differently. We design dashboard architecture around your specific objectives, data sources, user roles, workflows, and reporting requirements.
Rather than forcing your team into a predefined dashboard structure, we create interfaces that display the information your organization actually needs.
Real-Time Data Integration
Accurate decision-making depends on current information. Our dashboards can integrate with databases, APIs, trading systems, CRM platforms, financial systems, and other data sources to provide continuously updated information.
Real-time or near-real-time data integration reduces reliance on outdated exports and gives authorized users a clearer view of current business activity.
Financial and Trading Analytics
Financial businesses often need to monitor large volumes of rapidly changing information. We can develop dashboards covering areas such as:
- Trading volumes
- Client activity
- Deposits and withdrawals
- Revenue and fees
- Account performance
- Transaction activity
- Asset balances
- Market activity
- Customer acquisition
- Financial performance
These metrics can be presented through clear visualizations that help teams identify important changes quickly.
Role-Based Access Control
Different departments require different information. Our dashboards can incorporate role-based access controls so users only see the data and functionality relevant to their responsibilities.
Administrators, finance teams, sales representatives, compliance teams, managers, and other roles can have customized dashboard views and permissions.
Interactive Charts and Visualizations
Numbers become easier to understand when presented visually. We develop interactive charts, graphs, tables, KPI cards, progress indicators, and other visualization components to communicate complex information clearly.
Users can interact with visualizations to explore trends, compare results, and identify important changes without manually processing large datasets.
Advanced Filtering and Drill-Down
A useful dashboard should allow users to move from high-level performance indicators into the details behind them.
Custom filters and drill-down functionality can allow users to analyze information by:
- Date and time period
- Customer or account
- Product or service
- Geographic region
- Trading pair or asset
- Department
- Transaction type
- Campaign
- Performance category
- Other business-specific segments
This makes detailed analysis accessible without requiring manual spreadsheet manipulation.
Custom KPI Tracking
Every organization has different definitions of success. We build dashboards around the KPIs that are most relevant to your business.
Custom KPI components can display important measurements such as revenue, conversion rates, trading volumes, customer activity, acquisition costs, transaction counts, operational performance, and other business-specific indicators.
Automated Alerts and Thresholds
Important changes should not always require someone to constantly monitor a dashboard. Custom alert thresholds can be configured to identify specific conditions and notify relevant users when predefined limits are reached.
Alerts can support monitoring of financial metrics, trading activity, transaction volumes, account activity, system conditions, or other measurable business events.
Automated Reporting
Scheduled reporting reduces the need for teams to repeatedly prepare the same reports manually. Dashboards can be configured to generate and distribute recurring reports according to predefined schedules and recipient requirements.
This can help management and stakeholders stay informed without requiring someone to manually compile and distribute information each reporting period.
White-Label Dashboard Solutions
For businesses offering platforms to customers or partners, dashboards can be customized to match your existing brand identity.
Brand elements such as logos, typography, interface components, navigation structures, and visual guidelines can be incorporated to create a consistent experience under your own branding.
Admin and Management Dashboards
Management teams need visibility across the organization, while operational teams need detailed tools for day-to-day work. We design dashboards according to each user's responsibilities.
Administrative dashboards can include user management, financial information, operational statistics, reporting tools, system activity, configuration options, and other controls required by your organization.
Customer-Facing Dashboards
Dashboards can also be designed for customers and platform users. User-facing interfaces can provide account information, transaction history, balances, performance statistics, activity summaries, notifications, reports, and other relevant information.
The experience can be tailored to make important information easy to find and understand.
API and Database Integration
We connect dashboards with the systems that already power your business. Integrations can include REST APIs, databases, CRM systems, payment systems, trading platforms, ERP applications, analytics services, and other internal or third-party applications.
This creates a centralized view of information without requiring teams to switch between multiple systems.
Data Accuracy and Validation
A dashboard is only useful when the underlying information can be trusted. We consider data validation, synchronization, error handling, transformation, and consistency when building dashboard infrastructure.
Appropriate validation processes help reduce discrepancies and provide users with more reliable information for operational and analytical purposes.
Performance and Scalability
As data volumes and user numbers increase, dashboards need to remain responsive. We design dashboard architecture with performance and scalability in mind, including efficient data retrieval, appropriate caching strategies, optimized queries, and scalable infrastructure where required.
This helps maintain a practical user experience as your business grows.
Responsive Dashboard Design
Modern teams access information from different devices. Dashboards can be designed to work across desktop computers, laptops, tablets, and mobile devices where the use case requires it.
Responsive layouts ensure that important information remains accessible while adapting appropriately to different screen sizes.
Secure Data Access
Business dashboards frequently contain sensitive financial, customer, and operational information. Security is therefore considered throughout the development process.
Authentication, authorization, role-based access, secure API communication, session management, logging, and other appropriate security measures can be incorporated according to the platform's requirements.
Historical Data and Trend Analysis
Real-time information is valuable, but historical context is equally important. Dashboards can combine current data with historical records to help users identify trends, compare time periods, and evaluate changes in performance.
This creates a more complete view of business activity and supports informed decision-making.
Centralized Business Intelligence
Instead of relying on disconnected spreadsheets and manually prepared reports, a centralized dashboard can bring important information together in one environment.
Teams can access relevant KPIs, operational metrics, financial data, and performance information through a unified interface.
Continuous Improvement and Optimization
Business requirements change as organizations grow. Dashboard systems can be expanded with new metrics, reports, integrations, user roles, filters, alerts, and visualizations as new requirements emerge.
This allows your dashboard to evolve alongside your business rather than becoming another static reporting tool.
Built Around the Way Your Business Works
The most effective dashboard is not necessarily the one with the most charts. It is the one that presents the right information at the right time and makes important decisions easier.
Our Dashboard Development approach focuses on usability, data clarity, performance, security, automation, and practical business value.
Replace Manual Reporting With Intelligent Dashboards
Our Dashboard Development service transforms complex business data into structured, interactive, and actionable interfaces. From real-time financial and trading metrics to customer activity, operational KPIs, automated alerts, and scheduled reporting, every dashboard is built around your organization's specific requirements.
Bring your data together. Eliminate unnecessary manual reporting. Give every team access to the information they need.
Turn complex data into clear decisions. Automate reporting, monitor performance in real time, and build dashboards that genuinely work for your business.
Product specification
Quick product information

No review given yet!